SankeyMATIC Manual
Topic Index
Imbalances in Diagrams
What and Why
For many kinds of Sankey diagrams, it is important to make sure that all of the inputs are mapped to a visible output and that no amounts are unaccounted for.
Examples include:
- Budgets and other money flows, where each dollar (or each yen, etc.) must be accounted for.
- Energy diagrams, where 100% of inputs must map to outputs. (Typically, any unused energy is explicitly shown flowing to a 'Waste' or 'Rejected' node rather than simply stopping at some point before the end of the diagram).
Therefore, for every diagram, SankeyMATIC automatically compares total inputs and outputs for every node which has both.
If the inputs and outputs all match up, you will see a display like this below your diagram:
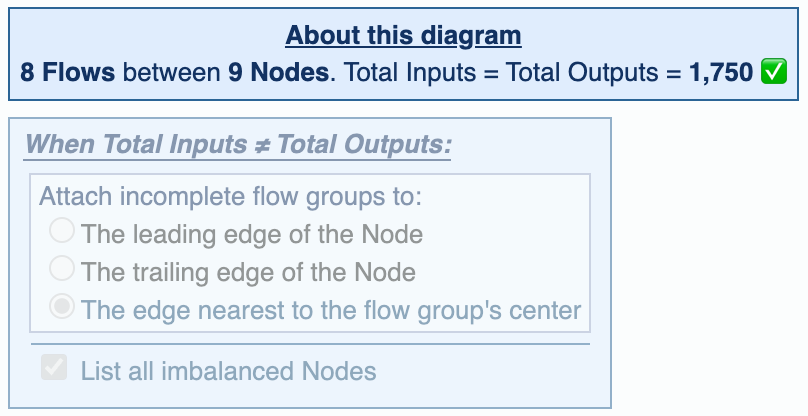
There is a checkbox ✅ indicating that the total inputs and outputs match up.
If the inputs and outputs do not all match, you will be shown some additional information:
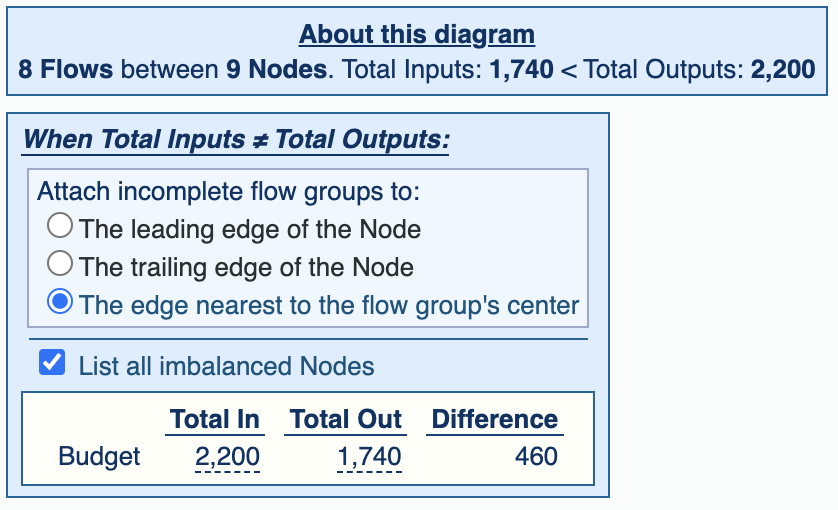
In this display, SankeyMATIC will tell you:
- the specific node names which have non-matching inputs and outputs
- the total amount in, the total amount out, and the difference between them.
- If you hover over one of the amounts, SankeyMATIC will list the specific amounts which are summing to that total.
Note: The diagram itself will not display any differently when there is an imbalance.
These messages are purely there to be useful to you as you create your diagram.
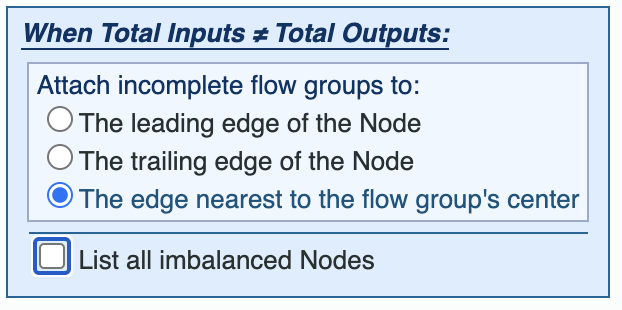
Turning off the list of imbalances
Some diagrams do not require inputs and outputs to be equal.
One popular example is a 'funnel'-style diagram, which shows a large number of initial values narrowing down to smaller numbers as you proceed through the diagram.
To hide the messages about specific imbalances, you can simply uncheck the box labeled “List all imbalanced Nodes”.
« Back: Syntax Reference
Next: Scaling Diagrams for Comparison »